I wrote a blogpost, but in a different blog that I however wanted to link to. It is a blog that is maintained by a bunch of open source digital forensics incident response people some of which are my current team mates.
The blogpost is about Time. More specific on some general ideas and concepts around time. It then goes on to explain how time is relevant in IT and why it is important in digital forensics. It also contains some recommendations that everyone can (and should) apply.
Here is a except of the goal of the blog post:
Goal This article explains the importance and challenges of time in digital forensics and incident response. You will learn how time is handled in various open source tools and get practical tips on managing time in your environment.
People are usually excited to play with the tools they have around, so was I. I am doing sports with different Garmin sport devices for multiple years and always was curious what you could find if you apply forensics tools on the device. So it might be interesting to forensicate your Garmin Watch, Bike computer or other Garmin devices. This blog post will go over some opportunities and how to do it. And what I learned from it.
If you are curious why you might use something like that, have a look at a recent entry from dcrainmaker.
Take an image
The first thing is always can we take a forensic image. For this the watch needs to be detected as a Mass Storage device (it is recommended to mount as read only!). For my testing I used a GARMIN Forerunner 45S. Once you attach it via USB, it will show up:
$ diskutil list
/dev/disk2 (external, physical):
#: TYPE NAME SIZE IDENTIFIER
0: GARMIN *10.3 MB disk2
$ diskutil unmountDisk /dev/disk2
Unmount of all volumes on disk2 was successful
We can now take a DD image (E01 would be even better, but for this articles purpose, I did not bother to do that, if you find yourself in a situation, where your evidence might be used in court etc, please use a write-blocker and have the image taking process tested and verified!):
$ sudo dd if=/dev/disk2 of=garmin_backup.img.dd bs=512
20066+0 records in
20066+0 records out
10273792 bytes transferred in 23.258457 secs (441723 bytes/sec)
Now we have a dd image of the watch and can continue investigating it without messing with the device itself. It is safe to unplug the device now.
First attempt is to just run the image using Plaso (Plaso Langar Að Safna Öllu) known for “super timeline all the things” to get a timeline. The easiest way is to use the docker version of Plaso:
docker run -v ./scripts/garmin/:/data log2timeline/plaso log2timeline --partition all /data/garmin_backup.img.dd.plaso /data/garmin_backup.img.dd
The resulting plaso file can then be e.g. uploaded to your Timesketch instance directly and will mostly show file related attributes / events, but still a good starting point.
Import Plaso file in Timesketch
The interesting files are in the Activities folder. But besides that we can see certain “expected” file related timestamps that Plaso can extract. To learn more about Timesketch, visit https://timesketch.org
So let’s continue and try to find out more about the activity fit file.
Using the mentioned above python library we can parse the file. What we are interested in is for sure the timestamp of the entry.
Depending on the event frequency there might be a lot of files in there.
After a bit I was successful putting every message in a pandas Dataframe, and also noticed that it might be interesting to keep the device metadata as well.
Here is my code (I ran it in a colab notebook):
def process_file(fitfile,filename):
  # Iterate over all messages of type "record"
  # (other types include "device_info", "file_creator", "event", etc)
  all_entries = []
  headers = []
  device_sting = ""
  for device in fitfile.get_messages("device_info"):
    #print(device.get_values())
    #device_sting = " ".join((device_sting, str(device.get_values())))
    all_entries.append(device.get_values())

  for record in fitfile.get_messages("record"):
      recordt_row = []
      entry = record.get_values()
      #if 'device_info' not in entry.keys():
      #  entry['device_info'] = device_sting
      recordt_row.append(record.get_values())
      #entry.append("device_info")
      #print(entry)
      # Records can contain multiple pieces of data (ex: timestamp, latitude, longitude, etc)
      all_entries.append(entry)

  df = pd.DataFrame(all_entries)
  if 'timestamp' in df:
    df['datetime'] = pd.to_datetime(df['timestamp'])
  else:
    return
  return df
With this you return a pandas dataframe that then can be easily imported into Timesketch for further analysis.
Watch it in Timesketch
For testing purposes I used the following .FIT file: https://github.com/dtcooper/python-fitparse/blob/master/tests/files/2019-02-17-062644-ELEMNT-297E-195-0.fit
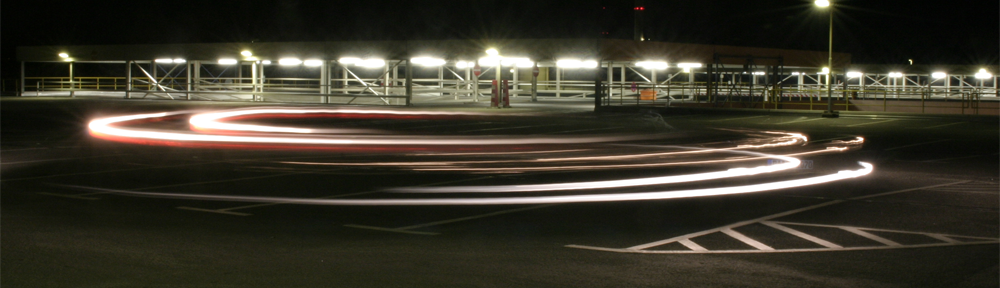
And in Timesketch it looks like:
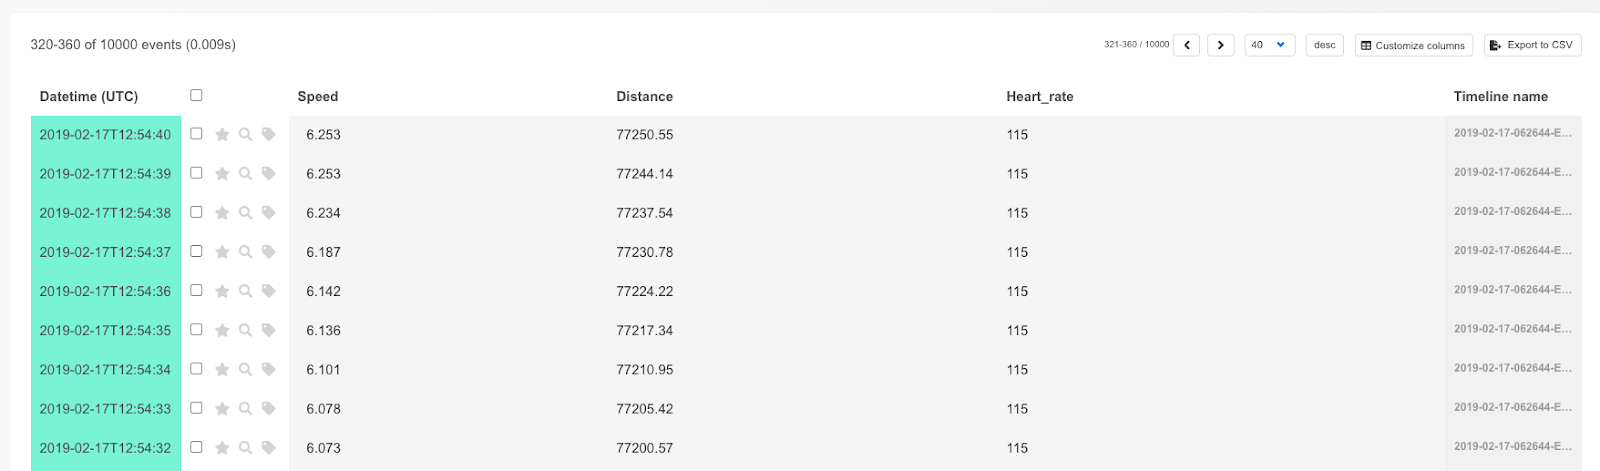
You also can look for Serial number of the Garmin Device:
Pretty cool!
Analyse your data with pandas
Once the data is in Timesketch, you can use sketch.explore to get the data back. With the following command:
Return all entries with GPS coordinates. With some extra packages:
!pip install -q folium
import folium
And the following code:
cur_df['lat'] = cur_df['position_lat'] /100000000 # hacky way, for some reason the coordinates where stored weird
cur_df['lon'] = cur_df['position_long']/100000000
cur_df.info()
cur_df

map1 = folium.Map(location=(49.850,	8.2462), zoom_start=3)
for index,row in df_new.iterrows():
  # Add the geocoded locations to the map
  folium.Marker(location=(row['lat'],row['lon']),popup='bla').add_to(map1)

display(map1)
You can actually plot a map with the coordinates:
And many more is possible. Hope you liked this article. The notebook is also available on Github. The idea is here was not to examine everything in detail, but give a foundation for further work on how to get the data in and get started.
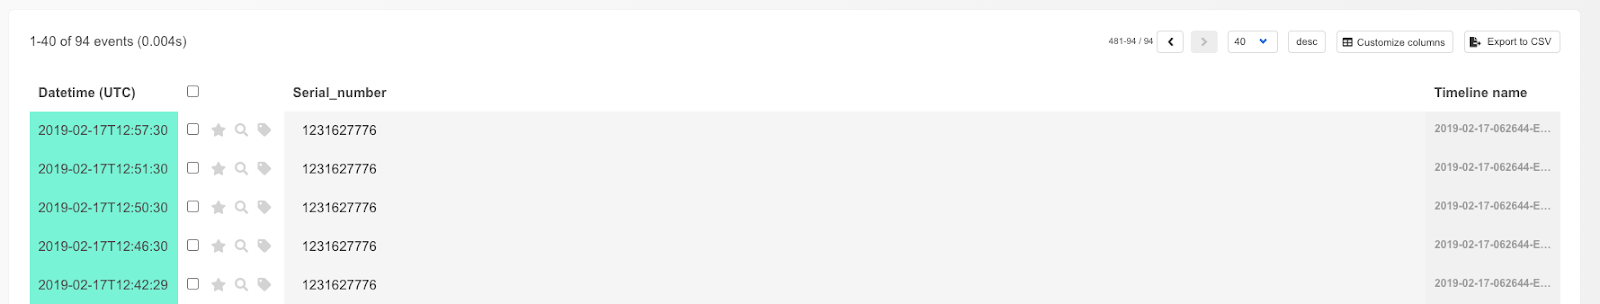
Together with two team members, I had the opportunity to give a webinar to 100+ virtual attendees covering a digital forensics scenario with Colab / Jupyter and Timesketch.
It was really fun and I hope people are able to get some ideas. The webinar did not cover all things we put into the notebook shared on the Timesketch Github repository, so even if you watched the webinar, it is still worth to check it out.
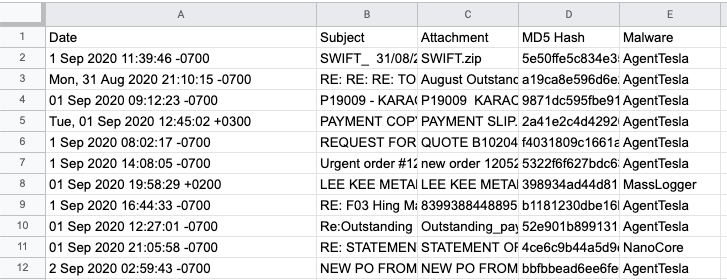
The great cocaman has released a new useful script to check IMAP accounts attachments for MalwareBazaar hits. He wrote about the script on his blog. The script generates a csv with timestamps. So for sure I wanted to check how easy it would be to get that data to Timesketch.
The date values however are really weird, so that is going to be fun as the sample file I got from cocaman had various formats, time zones and others in the column.
First step we open the csv in Google Sheets (my fav. csv parser) and do not let it parse any dates etc…
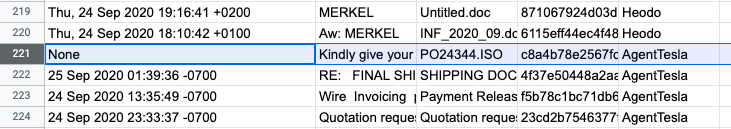
I removed one line where the date was “None” but of course spending a little more time could also solve that.
Download the csv again as csv.
Now lets move to colab for further stuff.
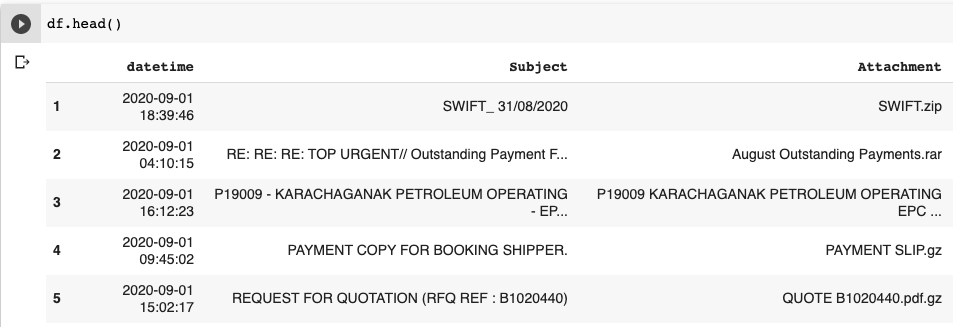
The process is pretty straightforward. Install google-colab and import the csv.
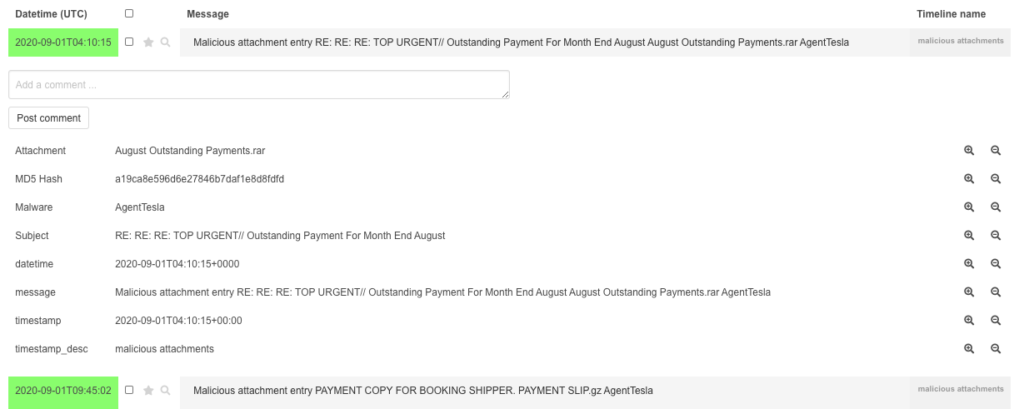
After formatting the date to be parsed and in a Timesketchable format, we can upload the pandas dataframe. The pandas dataframe looks like the following:
Timesketch, the open-source timeline collaboration tool recently upgraded the UI and that is why I am writing a new blog post to show the new UI by processing a E01 image via plaso.
First, install plaso and timesketch (in my case I used both via docker images as it is the easiest way to get it running.
As a scenario, I am using the image file provided by NIST. Which has been covered in many many blog posts already.
Processing via plaso
First, run the plaso docker container where the image file is stored.
docker run -v /evidence/:/data log2timeline/plaso log2timeline /data/evidences.plaso /data/4DellLatitudeCPi.E01
That will run for a while.
plaso - log2timeline version 20191203

Source path		: /data/4DellLatitudeCPi.E01
Source type		: storage media image
Processing time		: 00:23:38

Tasks:          Queued  Processing      Merging         Abandoned       Total
                0       0               0               0               12210

Identifier      PID     Status          Memory          Sources         Events          File
Main            7       completed       293.9 MiB       12210 (0)       168913 (0)
Worker_00       14      idle            288.7 MiB       5804 (0)        82139 (0)       TSK:/WINDOWS/system32/config/systemprofile/Start Menu/Programs/Accessories/Accessibility/Utility Manager.lnk
Worker_01       16      idle            268.9 MiB       6405 (0)        86774 (0)       TSK:/WINDOWS/system32/config/systemprofile/Start Menu/Programs/Accessories/Entertainment/desktop.ini

Processing completed.

Number of warnings generated while extracting events: 2.

Use pinfo to inspect warnings in more detail.
docker-compose up -d
export CONTAINER_ID="$(sudo docker container list -f name=development_timesketch -q)"
Import data
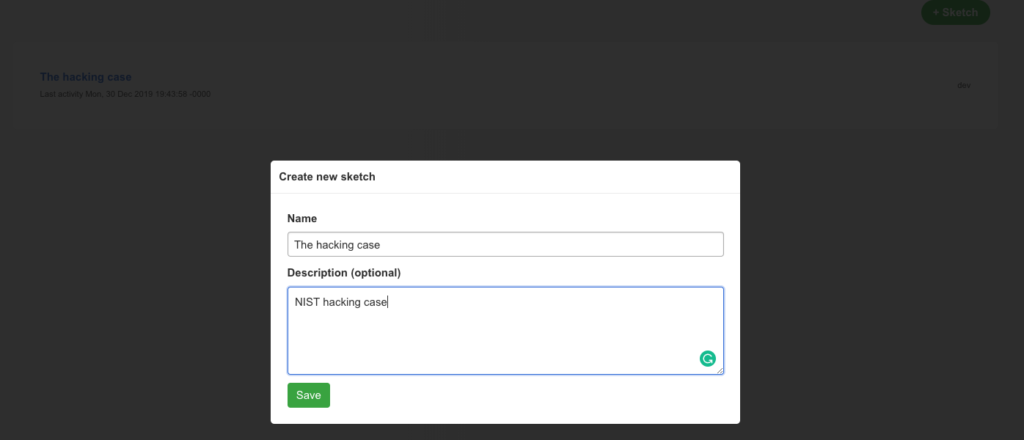
Create a case via Web UI
Create the Case in Timesketch
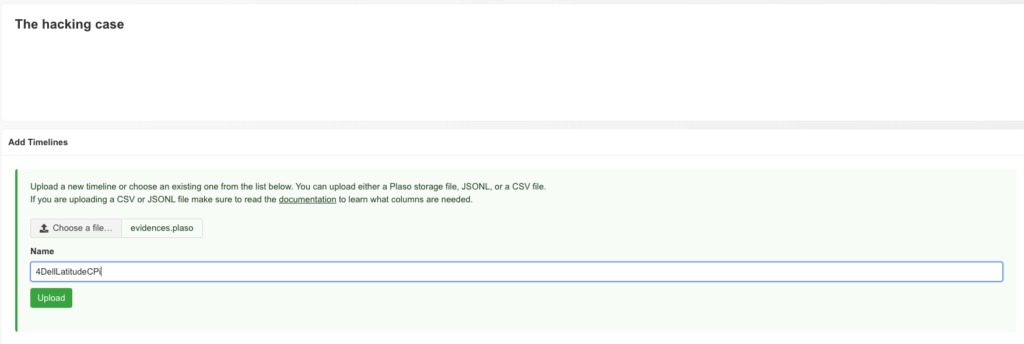
I decided to upload the plaso file via Web-UI.
Timesketch data upload
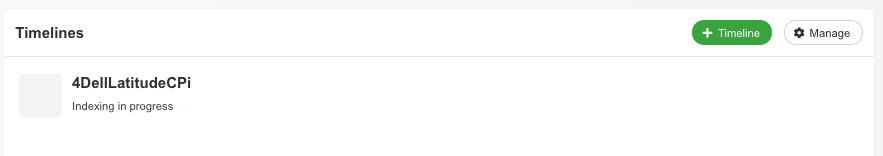
Also in the Web UI, process feedback is visible
Timesketch data uploading
Now data is being indexed
Timesketch data indexing
This will trigger an entry in the debug output
[2019-12-30 19:22:38,018: INFO/MainProcess] Received task: timesketch.lib.tasks.run_plaso[2ab18910-e2e1-4b0d-977c-948605b335dd]
[2019-12-30 19:22:38,088: INFO/ForkPoolWorker-1] Index timeline [evidences] to index [d3cf025c5c94498e8300190d92e483ae] (source: plaso)
[2019-12-30 19:24:13,148: INFO/ForkPoolWorker-1] Task timesketch.lib.tasks.run_plaso[2ab18910-e2e1-4b0d-977c-948605b335dd] succeeded in 95.0877274190002s: 'd3cf025c5c94498e8300190d92e483ae'
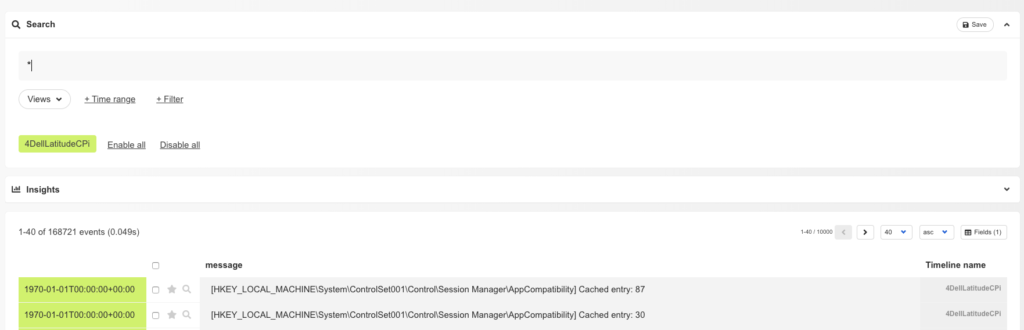
Data exploring
After indexing, the data is ready to be explored via Timesketch
Analyzers
One of the new cool features is Analyzers. These analyzers run predefined queries on the data of a timeline do some actions like
add tags to matching events (e.g. phishy-domains)
add new fields to an event (e.g. browser search would add a field called „search_string„
Answering questions
To showcase the power of Timesketch, let’s try to solve some of the questions of NIST that came along with the image
What operating system was used on the computer?
This is rather easy as plaso already has a parser for that, so searching for „Windows NT*CurrentVersion“ will do the job
What is the timezone settings?
Again, plaso is already parsing that, searching for „timezone“ will show „ActiveTimeBias: 300 Bias: 360 DaylightBias: -60 DaylightName: Central Daylight Time StandardBias: 0 StandardName: Central Standard Time„
Today, FoxIT published an blog post with an github repository listing potential CobaltStrike servers for the last few years.
I was interested in the data so I processed the data with my osint-timesketch scripts to add passiveDNS and passiveSSL data. I only took the IPs that where last seen >2019 to not create to much data.
Adding it to timesketch was pretty straight forward:
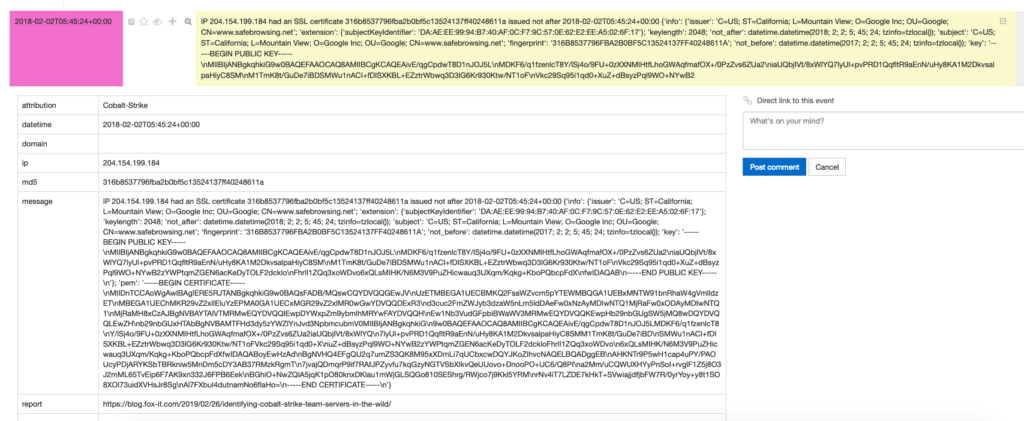
Some quick findings, after searching for google I discovered several weird certificates, among them.
Some weird things: safebrowsing(.)net is not owned by google, the IP to that certificate accoring to Virustotal https://www.virustotal.com/#/ip-address/204.154.199.184 is resolving to microsoftapis(.)com – for sure nothing good.
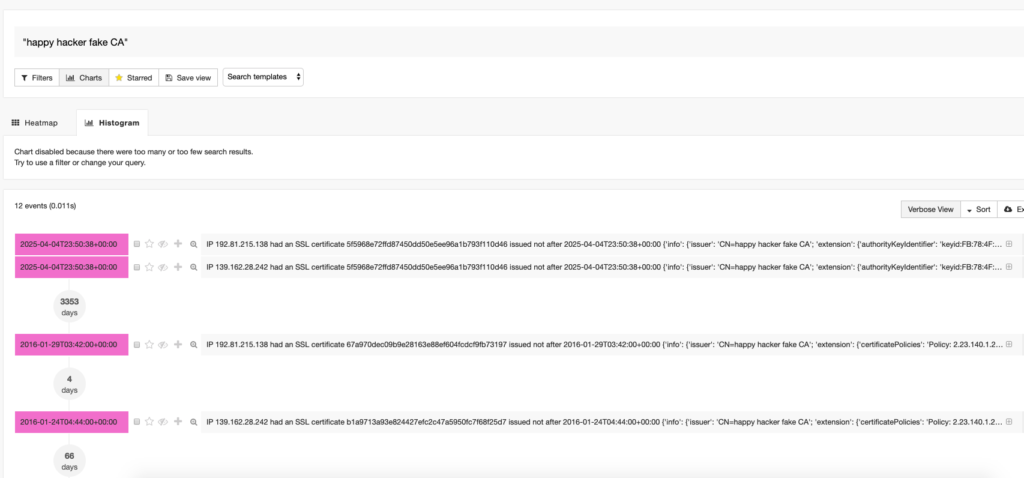
Some other funny things where found by a quick look…
Hack me if you can
Hack me if you can
Happy Hacker fake CA
Happy Hacker Fake CA
This outlines the importance of:
Share the data (kudos FoxIT!)
Provide researchers access to data sets (thx to CIRCL and Virustotal!)
Investigation bad people might involve bitcoin, the blockchain technology is very popular among criminals, as it is easy to use and „untraceable“ [1]. E.g. in most ransomware cases like „Ryuk“ [2] the company Crowdstrike has listed several bitcoin wallets, that they attribute to the threat actor.
How can that information help your investigation / your intelligence gathering? IN certain ways, you could track your own wallets for transactions to these wallets. Another aspect, that this blogpost will cover on is the timeline aspect of it.
As bitcoin transactions make use of the blockchain, who is public by design, it is possible to:
tell, how many bitcoins a certain wallet currently holds
see transactions from the past
The second aspect is what I want to focus on, because if we have a look at the transactions, we might be able to identify the point in time a certain group was active and enhance our other DFIR activities enriched with that information. The transaction log is like your journal of your bank account, it tells basically who is transferring money to a wallet and where the bitcoins are transferred to.
In the example above, the bitcoin wallets we are interested in are (Source Crowdstrike Blog post):
BTC Address
Total Received
No Received
Total Value (USD)
12vsQry1XrPjPCaH8gWzDJeYT7dhTmpcjL
55.00
3
$221,685.46
1Kx9TT76PHwk8sw7Ur6PsMWyEtaogX7wWY
182.99
10
$734,601.91
1FtQnqvjxEK5GJD9PthHM4MtdmkAeTeoRt
48.250
4
$188,974.93
14aJo5L9PTZhv8XX6qRPncbTXecb8Qohqb
25.00
2
$113,342.70
1E4fQqzCvS8wgqy5T7n1DW8JMNMaUbeFAS
0.001
1
$6.47
1GXgngwDMSJZ1Vahmf6iexKVePPXsxGS6H
30.00
3
$132,654.91
1Cyh35KqhhDewmXy63yp9ZMqBnAWe4oJRr
0.00
0
$0.00
15LsUgfnuGc1PsHJPcfLQJEnHm2FnGAgYC
0.00
0
$0.00
1CbP3cgi1Bcjuz6g2Fwvk4tVhqohqAVpDQ
13.00
2
$82,917.49
1Jq3WwsaPA7LXwRNYsfySsd8aojdmkFnW
35.00
1
$221,979.83
129L4gRSYgVJTRCgbPDtvYPabnk2QnY9sq
0.00
0
$0.00
1ET85GTps8eFbgF1MvVhFVZQeNp2a6LeGw
3.325
1
$12,661.74
1FRNVupsCyTjUvF36GxHZrvLaPtY6hgkTm
38.99
3
$246,893.95
1CW4kTqeoedinSmZiPYH7kvn4qP3mDJQVa
24.077
2
$152,727.13
13rTF3AYsf8xEdafUMT5W1E5Ab2aqPhkPi
0.00
0
$0.00
17zTcgKhF8XkWvkD4Y1N8634Qw37KwYkZT
0.00
0
$0.00
14dpmsn9rmdcS4dKD4GeqY2dYY6pwu4nVV
0.00
0
$0.00
17v2cu8RDXhAxufQ1YKiauBq6GGAZzfnFw
0.00
0
$0.00
1KUbXkjDZL6HC3Er34HwJiQUAE9H81Wcsr
10.00
1
$63,358.27
12UbZzhJrdDvdyv9NdCox1Zj1FAQ5onwx3
0.00
0
$0.00
1NMgARKzfaDExDSEsNijeT3QWbvTF7FXxS
0.00
0
$0.00
19AE1YN6Jo8ognKdJQ3xeQQL1mSZyX16op
25.00
1
$164,774.21
1L9fYHJJxeLMD2yyhh1cMFU2EWF5ihgAmJ
40.035
4
$259,478.16
18eu6KrFgzv8yTMVvKJkRM3YBAyHLonk5G
30.00
1
$198,651.35
1C8n86EEttnDjNKM9Tjm7QNVgwGBncQhDs
30.0082
2
$194,113.76
12N7W9ycLhuck9Q2wT8E6BaN6XzZ4DMLau
0.00
0
$0.00
162DVnddxsbXeVgdCy66RxEPADPETBGVBR
0.00
0
$0.00
1ChnbV4Rt7nsb5acw5YfYyvBFDj1RXcVQu
28.00
2
$175,177.98
1K6MBjz79QqfLBN7XBnwxCJb8DYUmmDWAt
1.7
2
$12,455.95
1EoyVz2tbGXWL1sLZuCnSX72eR7Ju6qohH
0.00
0
$0.00
1NQ42zc51stA4WAVkUK8uqFAjo1DbWv4Kz
0.00
0
$0.00
15FC73BdkpDMUWmxo7e7gtLRtM8gQgXyb4
0.00
0
$0.00
14hVKm7Ft2rxDBFTNkkRC3kGstMGp2A4hk
10.00
2
$64,990.62
1CN2iQbBikFK9jM34Nb3WLx5DCenQLnbXp
15.00
1
$92,934.80
1LKULheYnNtJXgQNWMo24MeLrBBCouECH7
0.00
0
$0.00
15RLWdVnY5n1n7mTvU1zjg67wt86dhYqNj
50.41
3
$326,477.83
1KURvApbe1yC7qYxkkkvtdZ7hrNjdp18sQ
0.00
0
$0.00
1NuMXQMUxCngJ7MNQ276KdaXQgGjpjFPhK
10
1
$41,034.54
Source of transaction information
There is a whole bunch of public webpages who give transaction history for a given wallet, but as it should be an automated step, the goal is to have a page with an API, after some searching I found: https://chain.so/api .
Making the call
Doing the API call to get transaction information is pretty simple:
Which is exactly what we need, with some Python JSON parsing, it is easy to get the info we want – the code I am using is available on https://github.com/deralexxx/osint_to_timesketch
After that we have an CSV with the date, the transaction happened, the raw information from the API and some meta data, enough to bake into a timeline.
Automation
The script is already made to output CSV files ready for importing them into Timesketch, as I found it to be the ideal tool to work with data points related to timestamps. Importing the CSV is straight forward and explained in the official documentation page [3].
The timeline csv looks like the following:
CSV of BTC history
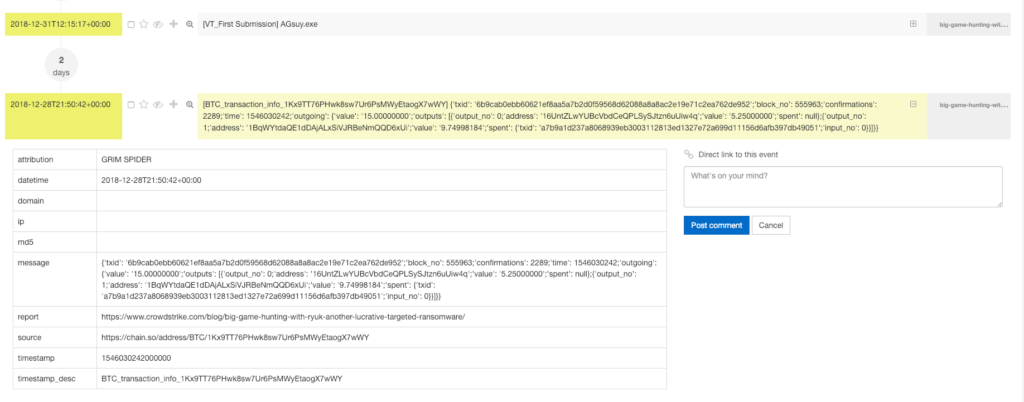
Making it pretty
Importing it into Timesketch, the timeline looks very nice:
BTC transactions in Timesketch
Added Value
Now what is the added value for investigations? The above is another layer of data points /evidence. It can be used to weight limit findings in your organisation, e.g. you assume you are hit by a phishing campaign, if your phishing campaign was seen a lot earlier or a lot later than the transactions above display, it is unlikely you are hit by the same campaign. It can also be used to make a case against individuals if enriched by host forensics – your imagination is the limit.
End
I hope the article is helpful and the scripts can be used, let me know via comments within the blog, issues on github or twitter messages https://twitter.com/alexanderjaeger if you have any questions, improvements.
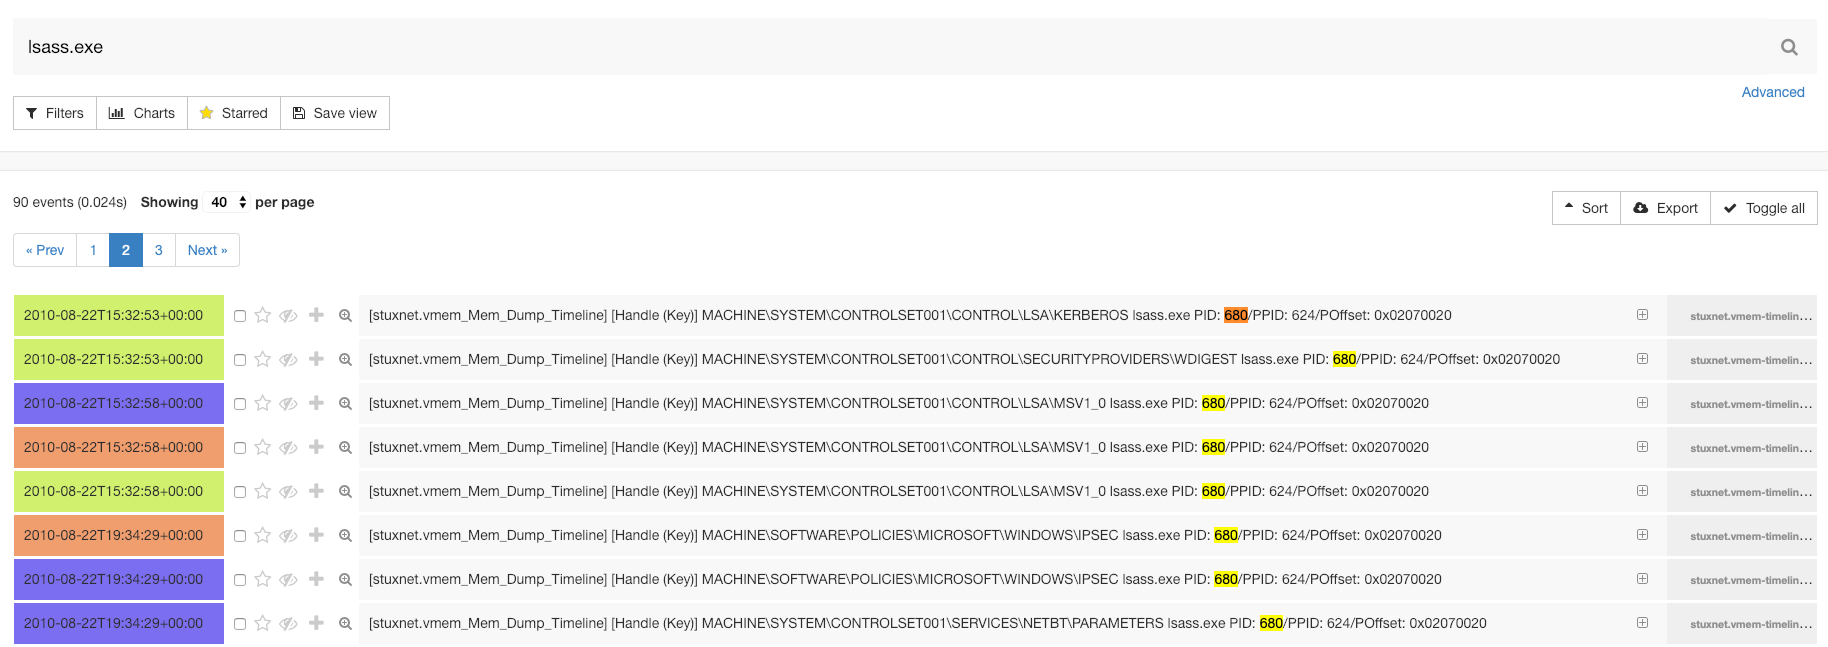
As you might know, I love to combine several OpenSource tools to get things done. One thing I wanted to play for some weeks is Autotimeliner by Andrea Fortuna.This tool is made to extract events from an Memory Image to combine it into a timeline. If you have a timeline, what comes next? Of course, putting it into Timesketch. So let’s give it a try.
We start with a memory dump from a Stuxnet infection from https://github.com/ganboing/malwarecookbook. Download the four files, extract them and you are good to go.
Prerequisites
Volatility
Installation is pretty easy, install Volatility either via pre-compiled binary or install it manually, see the Volatility installation wiki for further information.
A simple, intuitive web app for analysing and decoding data without having to deal with complex tools or programming languages. CyberChef encourages both technical and non-technical people to explore data formats, encryption and compression.
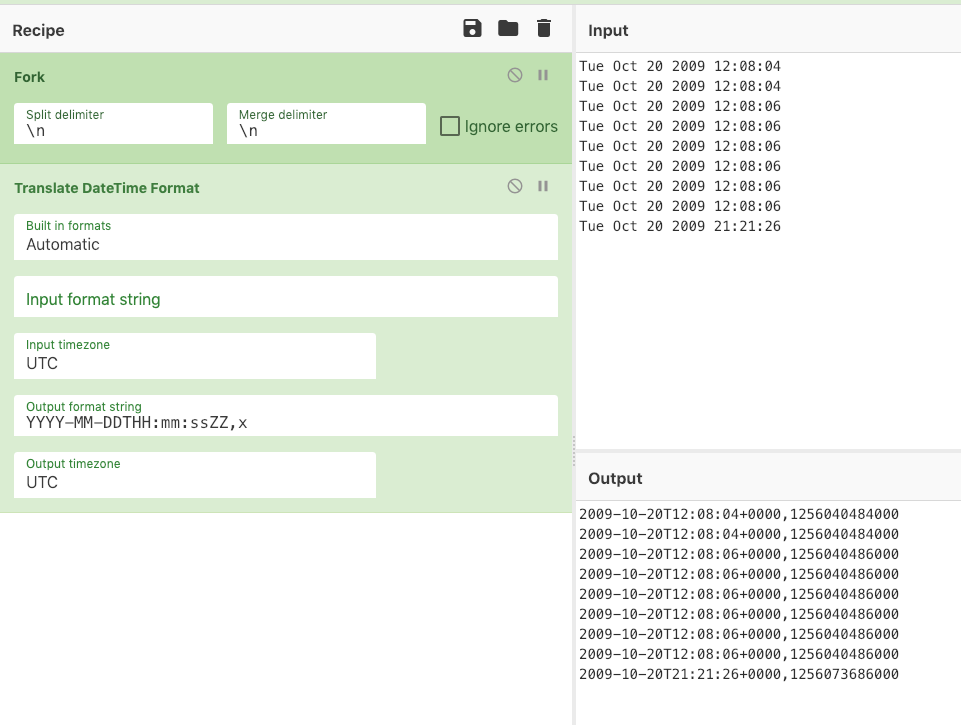
From the CSV that was generated, use your favourite tool to extract the first column of the csv which should look like that:
Date
Tue Oct 20 2009 12:08:04
Tue Oct 20 2009 12:08:04
Tue Oct 20 2009 12:08:06
Tue Oct 20 2009 12:08:06
Tue Oct 20 2009 12:08:06
Tue Oct 20 2009 12:08:06
Tue Oct 20 2009 12:08:06
Tue Oct 20 2009 12:08:06
Tue Oct 20 2009 21:21:26
Wed Oct 21 2009 00:02:28
Playing with Timesketch for a while and working on some OSINT timelines I was tired to investigate MD5 and domains / ips all manually so I tried to automate some of the work. Why is that important? If you have a list of hashes, domains and IPs, you of course can check your SIEM, EDR solution etc – but what if you have a hit? Would it benefit your investigation to at least have an idea of the timeframe something was used by attackers or seen in the wild?
Most shared indicators are lacking the timeframe, so we need to add those values by external information on our own.
Virustotal
There is no need to further explain Virustotal, it is basically a huge dataset of malware and information about domains and ips.
In particular information about a specific point in time a domain was seen to point to an IP and back is good to know to build your timeline.
E.g. if you have verymalicious.com pointing to 127.0.0.1 all the time, only on one day it was pointing to 1.2.3.4 – hits in your infrastructure should be higher escalated if seen during that day, out of that time window it might still be important, but not as urgent as during that day.
In regards to hash intelligence, Virustotal is nice, because if you add the info, when the last scan date of a file was, you can at least tell, that the file was known after that day.
I asked Virustotal to add more information they already have to the API and we will have wait till it is exposed:
First seen in the wild
First uploaded to VT
PE compile time
PassiveSSL
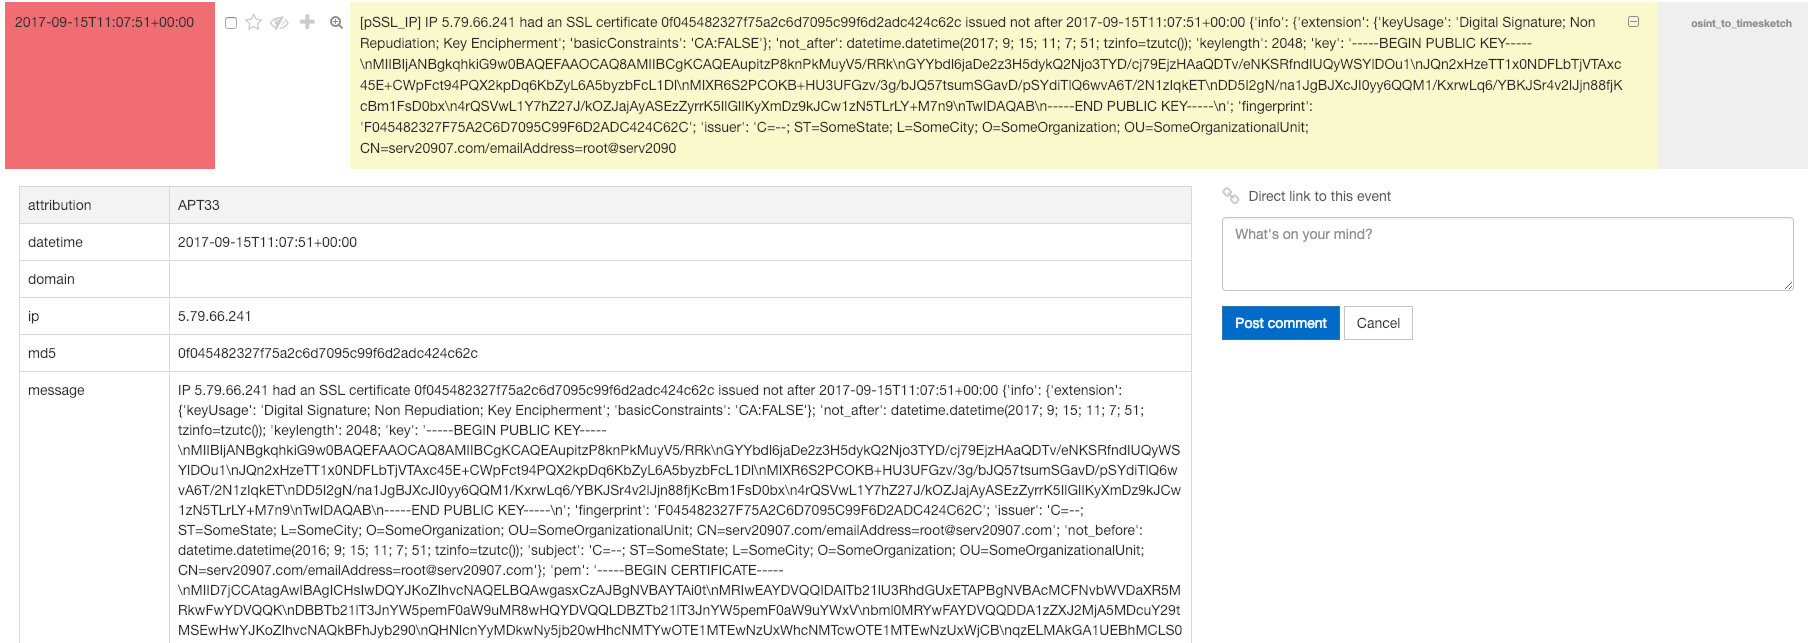
Alexandre Dulaunoy and Eireann Leverett have given a talk at the FIRST conference in Berlin back in 2015, which took my attention, but it took some time till I really had time to implement something to use the idea.
The basic idea is that, out of several sources, passive ssl services such as CIRCL passiveSSL collect certificates and expose information via API.
For timeline analysis in particular, the following dates are important as they might shine some light of attacker activity:
first seen in the wild
last seen in the wild
not use before
not use after
If you now add all of the information above, you might be able to get a better idea, when an IP / Domain / File was active.
This information should then be fed into a Timesketch investigation.
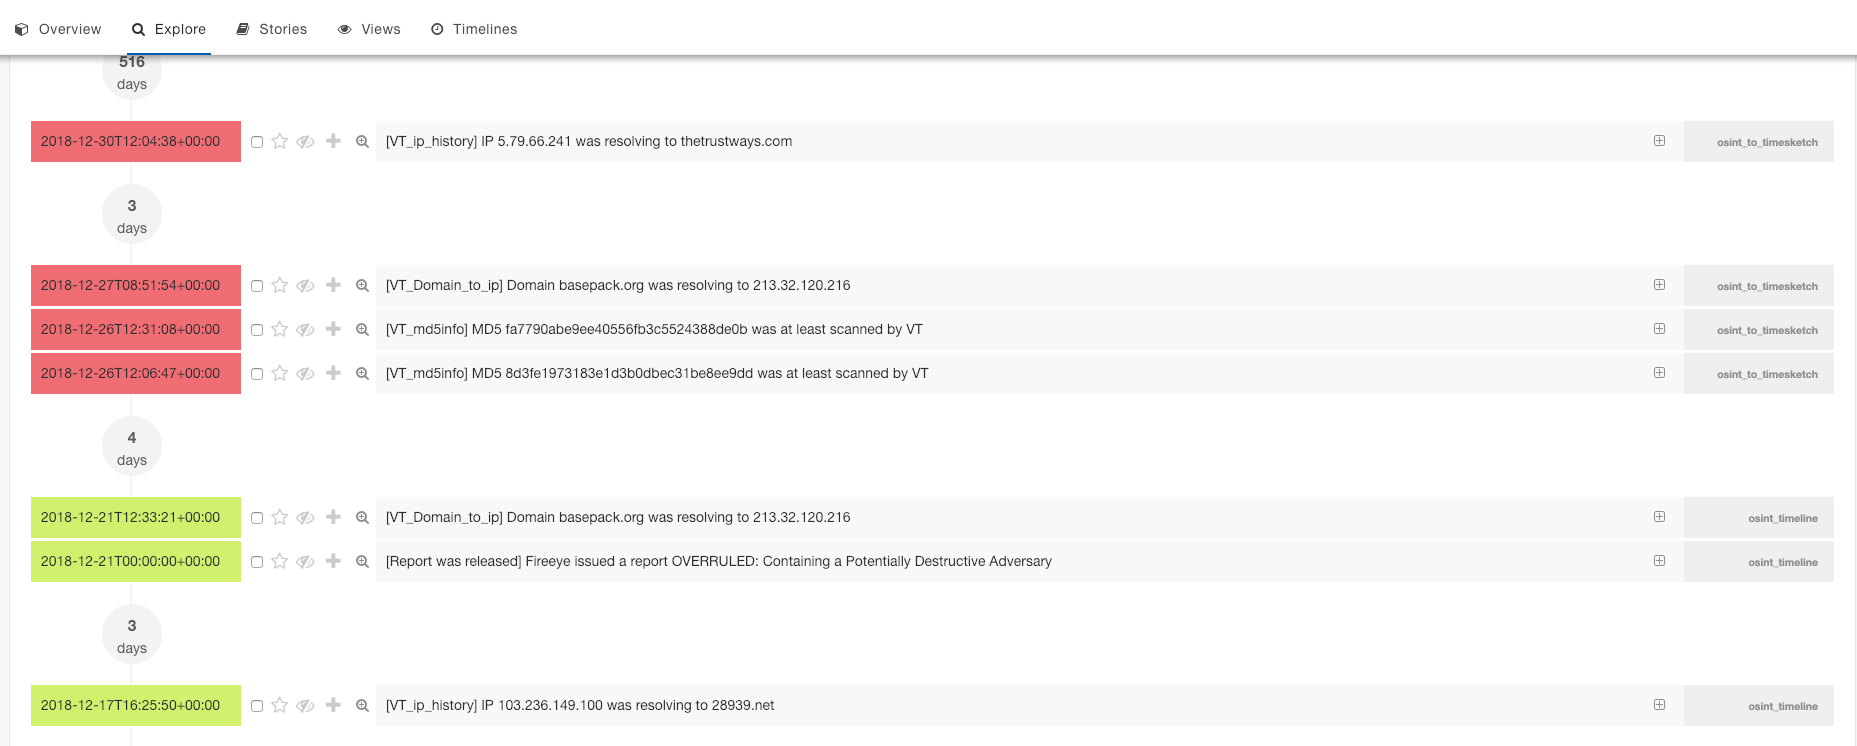
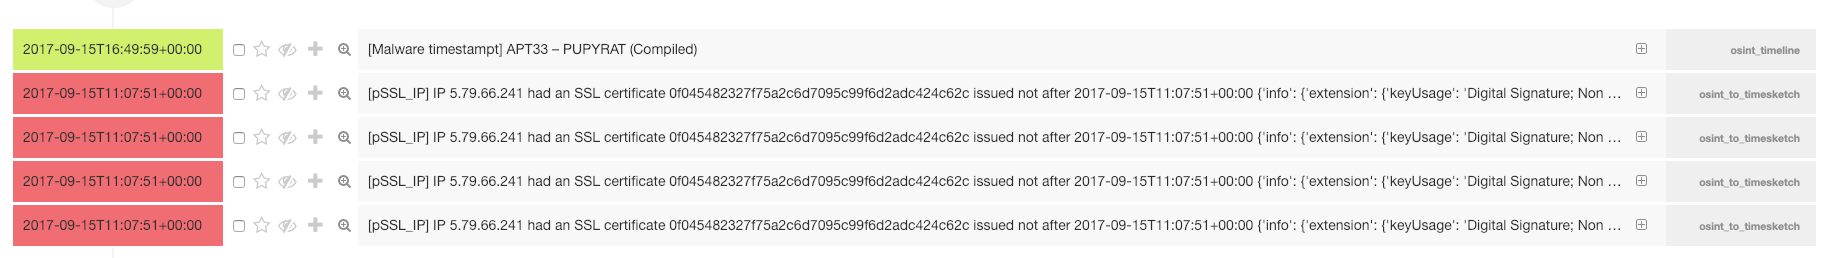
Example
Using some sample data from APT33: https://github.com/deralexxx/osint-timelines/blob/master/2018/2018-12-21.OVERRULED:-Containing-a-Potentially-Destructive-Adversary-APT33.csv
Combining with the python script below with the following indicators: