Bitcoin transaction in timelines

Investigation bad people might involve bitcoin, the blockchain technology is very popular among criminals, as it is easy to use and „untraceable“ [1]. E.g. in most ransomware cases like „Ryuk“ [2] the company Crowdstrike has listed several bitcoin wallets, that they attribute to the threat actor.

How can that information help your investigation / your intelligence gathering? IN certain ways, you could track your own wallets for transactions to these wallets. Another aspect, that this blogpost will cover on is the timeline aspect of it.

As bitcoin transactions make use of the blockchain, who is public by design, it is possible to:

  • tell, how many bitcoins a certain wallet currently holds
  • see transactions from the past

The second aspect is what I want to focus on, because if we have a look at the transactions, we might be able to identify the point in time a certain group was active and enhance our other DFIR activities enriched with that information. The transaction log is like your journal of your bank account, it tells basically who is transferring money to a wallet and where the bitcoins are transferred to.

In the example above, the bitcoin wallets we are interested in are (Source Crowdstrike Blog post):

BTC AddressTotal ReceivedNo ReceivedTotal Value (USD)
12vsQry1XrPjPCaH8gWzDJeYT7dhTmpcjL55.003$221,685.46
1Kx9TT76PHwk8sw7Ur6PsMWyEtaogX7wWY182.9910$734,601.91
1FtQnqvjxEK5GJD9PthHM4MtdmkAeTeoRt48.2504$188,974.93
14aJo5L9PTZhv8XX6qRPncbTXecb8Qohqb25.002$113,342.70
1E4fQqzCvS8wgqy5T7n1DW8JMNMaUbeFAS0.0011$6.47
1GXgngwDMSJZ1Vahmf6iexKVePPXsxGS6H30.003$132,654.91
1Cyh35KqhhDewmXy63yp9ZMqBnAWe4oJRr0.000$0.00
15LsUgfnuGc1PsHJPcfLQJEnHm2FnGAgYC0.000$0.00
1CbP3cgi1Bcjuz6g2Fwvk4tVhqohqAVpDQ13.002$82,917.49
1Jq3WwsaPA7LXwRNYsfySsd8aojdmkFnW35.001$221,979.83
129L4gRSYgVJTRCgbPDtvYPabnk2QnY9sq0.000$0.00
1ET85GTps8eFbgF1MvVhFVZQeNp2a6LeGw3.3251$12,661.74
1FRNVupsCyTjUvF36GxHZrvLaPtY6hgkTm38.993$246,893.95
1CW4kTqeoedinSmZiPYH7kvn4qP3mDJQVa24.0772$152,727.13
13rTF3AYsf8xEdafUMT5W1E5Ab2aqPhkPi0.000$0.00
17zTcgKhF8XkWvkD4Y1N8634Qw37KwYkZT0.000$0.00
14dpmsn9rmdcS4dKD4GeqY2dYY6pwu4nVV0.000$0.00
17v2cu8RDXhAxufQ1YKiauBq6GGAZzfnFw0.000$0.00
1KUbXkjDZL6HC3Er34HwJiQUAE9H81Wcsr10.001$63,358.27
12UbZzhJrdDvdyv9NdCox1Zj1FAQ5onwx30.000$0.00
1NMgARKzfaDExDSEsNijeT3QWbvTF7FXxS0.000$0.00
19AE1YN6Jo8ognKdJQ3xeQQL1mSZyX16op25.001$164,774.21
1L9fYHJJxeLMD2yyhh1cMFU2EWF5ihgAmJ40.0354$259,478.16
18eu6KrFgzv8yTMVvKJkRM3YBAyHLonk5G30.001$198,651.35
1C8n86EEttnDjNKM9Tjm7QNVgwGBncQhDs30.00822$194,113.76
12N7W9ycLhuck9Q2wT8E6BaN6XzZ4DMLau0.000$0.00
162DVnddxsbXeVgdCy66RxEPADPETBGVBR0.000$0.00
1ChnbV4Rt7nsb5acw5YfYyvBFDj1RXcVQu28.002$175,177.98
1K6MBjz79QqfLBN7XBnwxCJb8DYUmmDWAt1.72$12,455.95
1EoyVz2tbGXWL1sLZuCnSX72eR7Ju6qohH0.000$0.00
1NQ42zc51stA4WAVkUK8uqFAjo1DbWv4Kz0.000$0.00
15FC73BdkpDMUWmxo7e7gtLRtM8gQgXyb40.000$0.00
14hVKm7Ft2rxDBFTNkkRC3kGstMGp2A4hk10.002$64,990.62
1CN2iQbBikFK9jM34Nb3WLx5DCenQLnbXp15.001$92,934.80
1LKULheYnNtJXgQNWMo24MeLrBBCouECH70.000$0.00
15RLWdVnY5n1n7mTvU1zjg67wt86dhYqNj50.413$326,477.83
1KURvApbe1yC7qYxkkkvtdZ7hrNjdp18sQ0.000$0.00
1NuMXQMUxCngJ7MNQ276KdaXQgGjpjFPhK101$41,034.54

Source of transaction information

There is a whole bunch of public webpages who give transaction history for a given wallet, but as it should be an automated step, the goal is to have a page with an API, after some searching I found: https://chain.so/api .

Making the call

Doing the API call to get transaction information is pretty simple:

GET /api/v2/address/{NETWORK}/{ADDRESS} 

That will give you the following information

{
  "status": "success",
  "data": {
    "network": "DOGE",
    "address": "DM7Yo7YqPtgMsGgphX9RAZFXFhu6Kd6JTT",
    "balance": "31.03885339",
    "received_value": "25828731.93733507",
    "pending_value": "0.0",
    "total_txs": 225,
    "txs": [ ... ]
}

Which is exactly what we need, with some Python JSON parsing, it is easy to get the info we want – the code I am using is available on https://github.com/deralexxx/osint_to_timesketch

After that we have an CSV with the date, the transaction happened, the raw information from the API and some meta data, enough to bake into a timeline.

Automation

The script is already made to output CSV files ready for importing them into Timesketch, as I found it to be the ideal tool to work with data points related to timestamps. Importing the CSV is straight forward and explained in the official documentation page [3].

The timeline csv looks like the following:
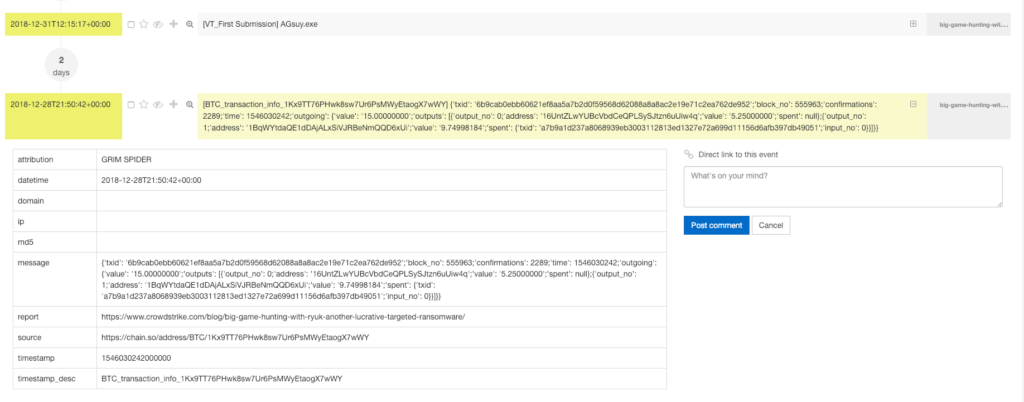
CSV of BTC history

Making it pretty

Importing it into Timesketch, the timeline looks very nice:

BTC transactions in Timesketch

Added Value

Now what is the added value for investigations? The above is another layer of data points /evidence. It can be used to weight limit findings in your organisation, e.g. you assume you are hit by a phishing campaign, if your phishing campaign was seen a lot earlier or a lot later than the transactions above display, it is unlikely you are hit by the same campaign. It can also be used to make a case against individuals if enriched by host forensics – your imagination is the limit.

End

I hope the article is helpful and the scripts can be used, let me know via comments within the blog, issues on github or twitter messages https://twitter.com/alexanderjaeger if you have any questions, improvements.

Thx for reading

Further reading / references

  • [1] http://www.sciencemag.org/news/2016/03/why-criminals-cant-hide-behind-bitcoin
  • [2] https://www.crowdstrike.com/blog/big-game-hunting-with-ryuk-another-lucrative-targeted-ransomware/
  • [3] https://github.com/google/timesketch/blob/master/docs/CreateTimelineFromJSONorCSV.md

timesketch-tools

Overview

I am happy to say that a new tool made it to github called „timesketch-tools“.
It is basically a way to interact with Timesketch via CLI. For those who don’t know Timesketch, it is an amazing opensource tool developed by Johan Berggren and is used to create timelines for forensic investigations as well as incident response cases.

Reason

Back in 2017, Johan tweeted:

Why is the WebUi not enough? Well in some cases you might want to automate stuff, have no browser or other reasons, so it is not „Why“ but „why not“.

So I did during the last few days and built a client for it: timesketch-tools

Capabilities

At the moment only two methods do work, but it should be enough to show the power of it.

List sketches

timesketch-tools.py -ls
     
         _______               __       __      __ 
        /_  __(_)_ _  ___ ___ / /_____ / /_____/ / 
         / / / /  ' \/ -_|_-</  '_/ -_) __/ __/ _          
        /_/ /_/_/_/_/\__/___/_/\_\__/\__/\__/_//_/-tools v0.1

            
+-----+-----------------------------+
|  id |             Name            |
+-----+-----------------------------+
| 130 |     test1Untitled sketch    |
|  3  | The Greendale investigation |
+-----+-----------------------------+

Add event

timesketch-tools.py --add_events
     
         _______               __       __      __ 
        /_  __(_)_ _  ___ ___ / /_____ / /_____/ / 
         / / / /  ' \/ -_|_-</  '_/ -_) __/ __/ _          
        /_/ /_/_/_/_/\__/___/_/\_\__/\__/\__/_//_/-tools v0.1

            
Please provide the sketch id you want to add events to as (an integer): 3
Please provide informations to the event you would like to add timestamp, timestamp_desc, message will be promted

Timestamp (use Format: YYYY-mm-ddTHH:MM:SS+00:00 2018-01-15T10:45:50+00:00) use c for current time c
timestamp_desc this is the description
message something was hacked
Event added, ID: 18 Date:2018-10-31T14:49:41+00:00 timestamp desc this is the description messagesomething was hacked
Add another event? (y/n)n

I have a lot of ideas to improve, so expect some more functionality added soon…

Komand-tools

Out of my attempt to reverse engineer the Komand API (a security orchestration tool) I found myself writing some python helper to use the API. Maybe it is useful for some people, so I decided to OpenSource it.

It is hard to understand why a tool, thats main purpose it to connect APIs does not have an API documentation / client itself.

Usage should be pretty simple, clone the repository and good to go:


usage: komand-tools.py [-h] [-v] [-wm] [-j JOB]

optional arguments:
-h, --help show this help message and exit
-v, --verbose increase output verbosity
-wm, --workflow_map show workflow map
-j JOB, --job JOB show job status

Feel free to open Issues or Make Pull Requests. The repository is hosted on Github: https://github.com/deralexxx/komand-tools/

Raspberry Pi nagios open monitoring distribution

This Blog Post will cover a howto for a complete monitoring setup.

I wanted to create a monitoring solution for a bunch of Raspberry Pi, a FritzBox, a QNAP Nas, Windows Clients and Apple OSX Workstation.

The monitoring device is another Raspberry Pi with Raspian installed.

The first coice for a monitoring solution is of course Nagios. It’s free, it’s open source and it’s high scalable. The problem with Nagios out of the box: it’s complex, it is too complex to do it in the small home network.

To save time, there is an complete collection of tools called OMD – open monitoring distribution.

OMD avoids the tedious work of manually compiling and integrating Nagios addons while at the same time avoiding the problems of pre-packaged installations coming with your Linux distribution, which are most times outdated and provide no regular updates.

OMD bundles Nagios together with many important addons and can easily be installed on every major Linux distribution. We provide prebuilt packages for all enterprise Linux distributions and also for some other, such as Ubuntu.

A german howto for installing OMD on an Raspberry Pi is available here.

This monitoring pi is now named nagiospi.

But to use the version 1.0 you will need the following commands:


sudo su
echo 'deb http://labs.consol.de/repo/stable/debian wheezy main' >> /etc/apt/sources.list
gpg --keyserver keys.gnupg.net --recv-keys F8C1CA08A57B9ED7 #install PGP Key of Sven Nierlein sven.nierlein@consol.de
gpg --armor --export F8C1CA08A57B9ED7 | apt-key add -
apt-get update
pi@nagiospi ~ $ sudo apt-cache search omd
cp2k - Ab Initio Molecular Dynamics
customdeb - Modfies binary Debian package
dicomnifti - converts DICOM files into the NIfTI format
isomd5sum - ISO9660 checksum utilities
libtemplate-provider-fromdata-perl - module to load templates from your __DATA__ section
python-pyisomd5sum - ISO9660 checksum Python module
tofrodos - Converts DOS Unix text files, alias tofromdos
vrflash - tool to flash kernels and romdisks to Agenda VR
omd - Open Source Monitoring Distribution
omd-1.00 - Open Source Monitoring Distribution, containing Nagios,
root@nagiospi:/#apt-get install omd-1.00

After that you have to install a OMD site:


root@nagiospi:/#omd create pimon
will create a folder /omd/sites/pimon/tmp
root@nagiospi:/#ifconfig # to gather the IP of your Pi

You can now access the webpage using


The site can be started with omd start pipi. The default web UI is available at http://raspberrypi/pipi/ The admin user for the web applications is omdadmin with password omd. Please do a su - pipi for administration of this site.

root@nagiospi:~# omd start pimon
Starting dedicated Apache for site pimon…OK
Starting rrdcached…OK
Starting npcd…OK
Starting nagios…OK
Initializing Crontab…OK
root@nagiospi:~#

Now access http://$IP_OF_YOUR_PI/pimon with default credentials stated before.

To gather data, you will now have to login to another pi: senderpi.

The senderpi will provide an interface / port for the nagiospi to collect data. To do so, the script check-mk from Matias Kettner is perfect. It is available for Linux, Windows etc.

Want to learn more about Nagios / Monitoring:

root@senderpi:/#sudo apt-get install xinetd check-mk-agent

After that you have to edit at least the file: vi /etc/xinetd.d/check_mk
For security reasons, remove the # in the line and include the IP of $nagiospi

root@senderpi:/#vi /etc/xinetd.d/check_mk
only_from = 127.0.0.1 $IP_OF_YOUR_NAGIOSPI

so that only your nagiospi can access the port and the information.
To enable the script, change the value in the file from yes to:

disable = no

Restart xinetd:

root@senderpi:/# service xinetd restart
[ ok ] Stopping internet superserver: xinetd.
[ ok ] Starting internet superserver: xinetd.

Check if the service is running:

root@senderpi:/# netstat -anon | grep 6556
tcp 0 0 0.0.0.0:6556 0.0.0.0:* LISTEN aus (0.00/0/0)
root@senderpi:/# nc 127.0.0.1 6556
<<<check_mk>>>
Version: 1.1.12p7
AgentOS: linux
PluginsDirectory: /usr/lib/check_mk_agent/plugins
LocalDirectory: /usr/lib/check_mk_agent/local
AgentDirectory: /etc/check_mk
OnlyFrom: 127.0.0.1 $IP_OF_YOUR_NAGIOSPI
(...)

To increase security, use the following iptables rule to prohibit unauthorized access to the OMD / Nagios / mk-check port:

iptables -A INPUT -i eth0 -p tcp -s $IP_OF_YOUR_NAGIOSPI --dport 6556 -m state --state NEW,ESTABLISHED -j ACCEPT

You can also check from your nagiospi command line:

nc covert 6556 $IP_OF_YOUR_SENDER_PI

Now go to the page:

http://$IP_OF_YOUR_NAGIOSPI/pimon/check_mk/
Default username: omdadmin password: omd

And go to „Hosts and folders“ on the left menu.

Click create host and insert all of the data:$IP_OF_YOUR_SENDER_PI.
–> Save and check services
Your nagiospi now tries to connect to your senderpi and checks for info.
Save it.
On the top screen there is a button „1 Change“ klick it and confirm it.

To change the password:

http://$IP_OF_YOUR_NAGIOSPI/pimon/thruk/#cgi-bin/conf.cgi?sub=users&action=change&data.username=omdadmin&

Now your host has been added to monitoring. All information should be available to your nagios and you will be alerted e.g. the SD card of the PI is running out of space.